Phenpath contains 7137 phenotypes, associated to diseases, genes and pathways. A summary of the level of annotation of phenotypes is shown in Table 1.
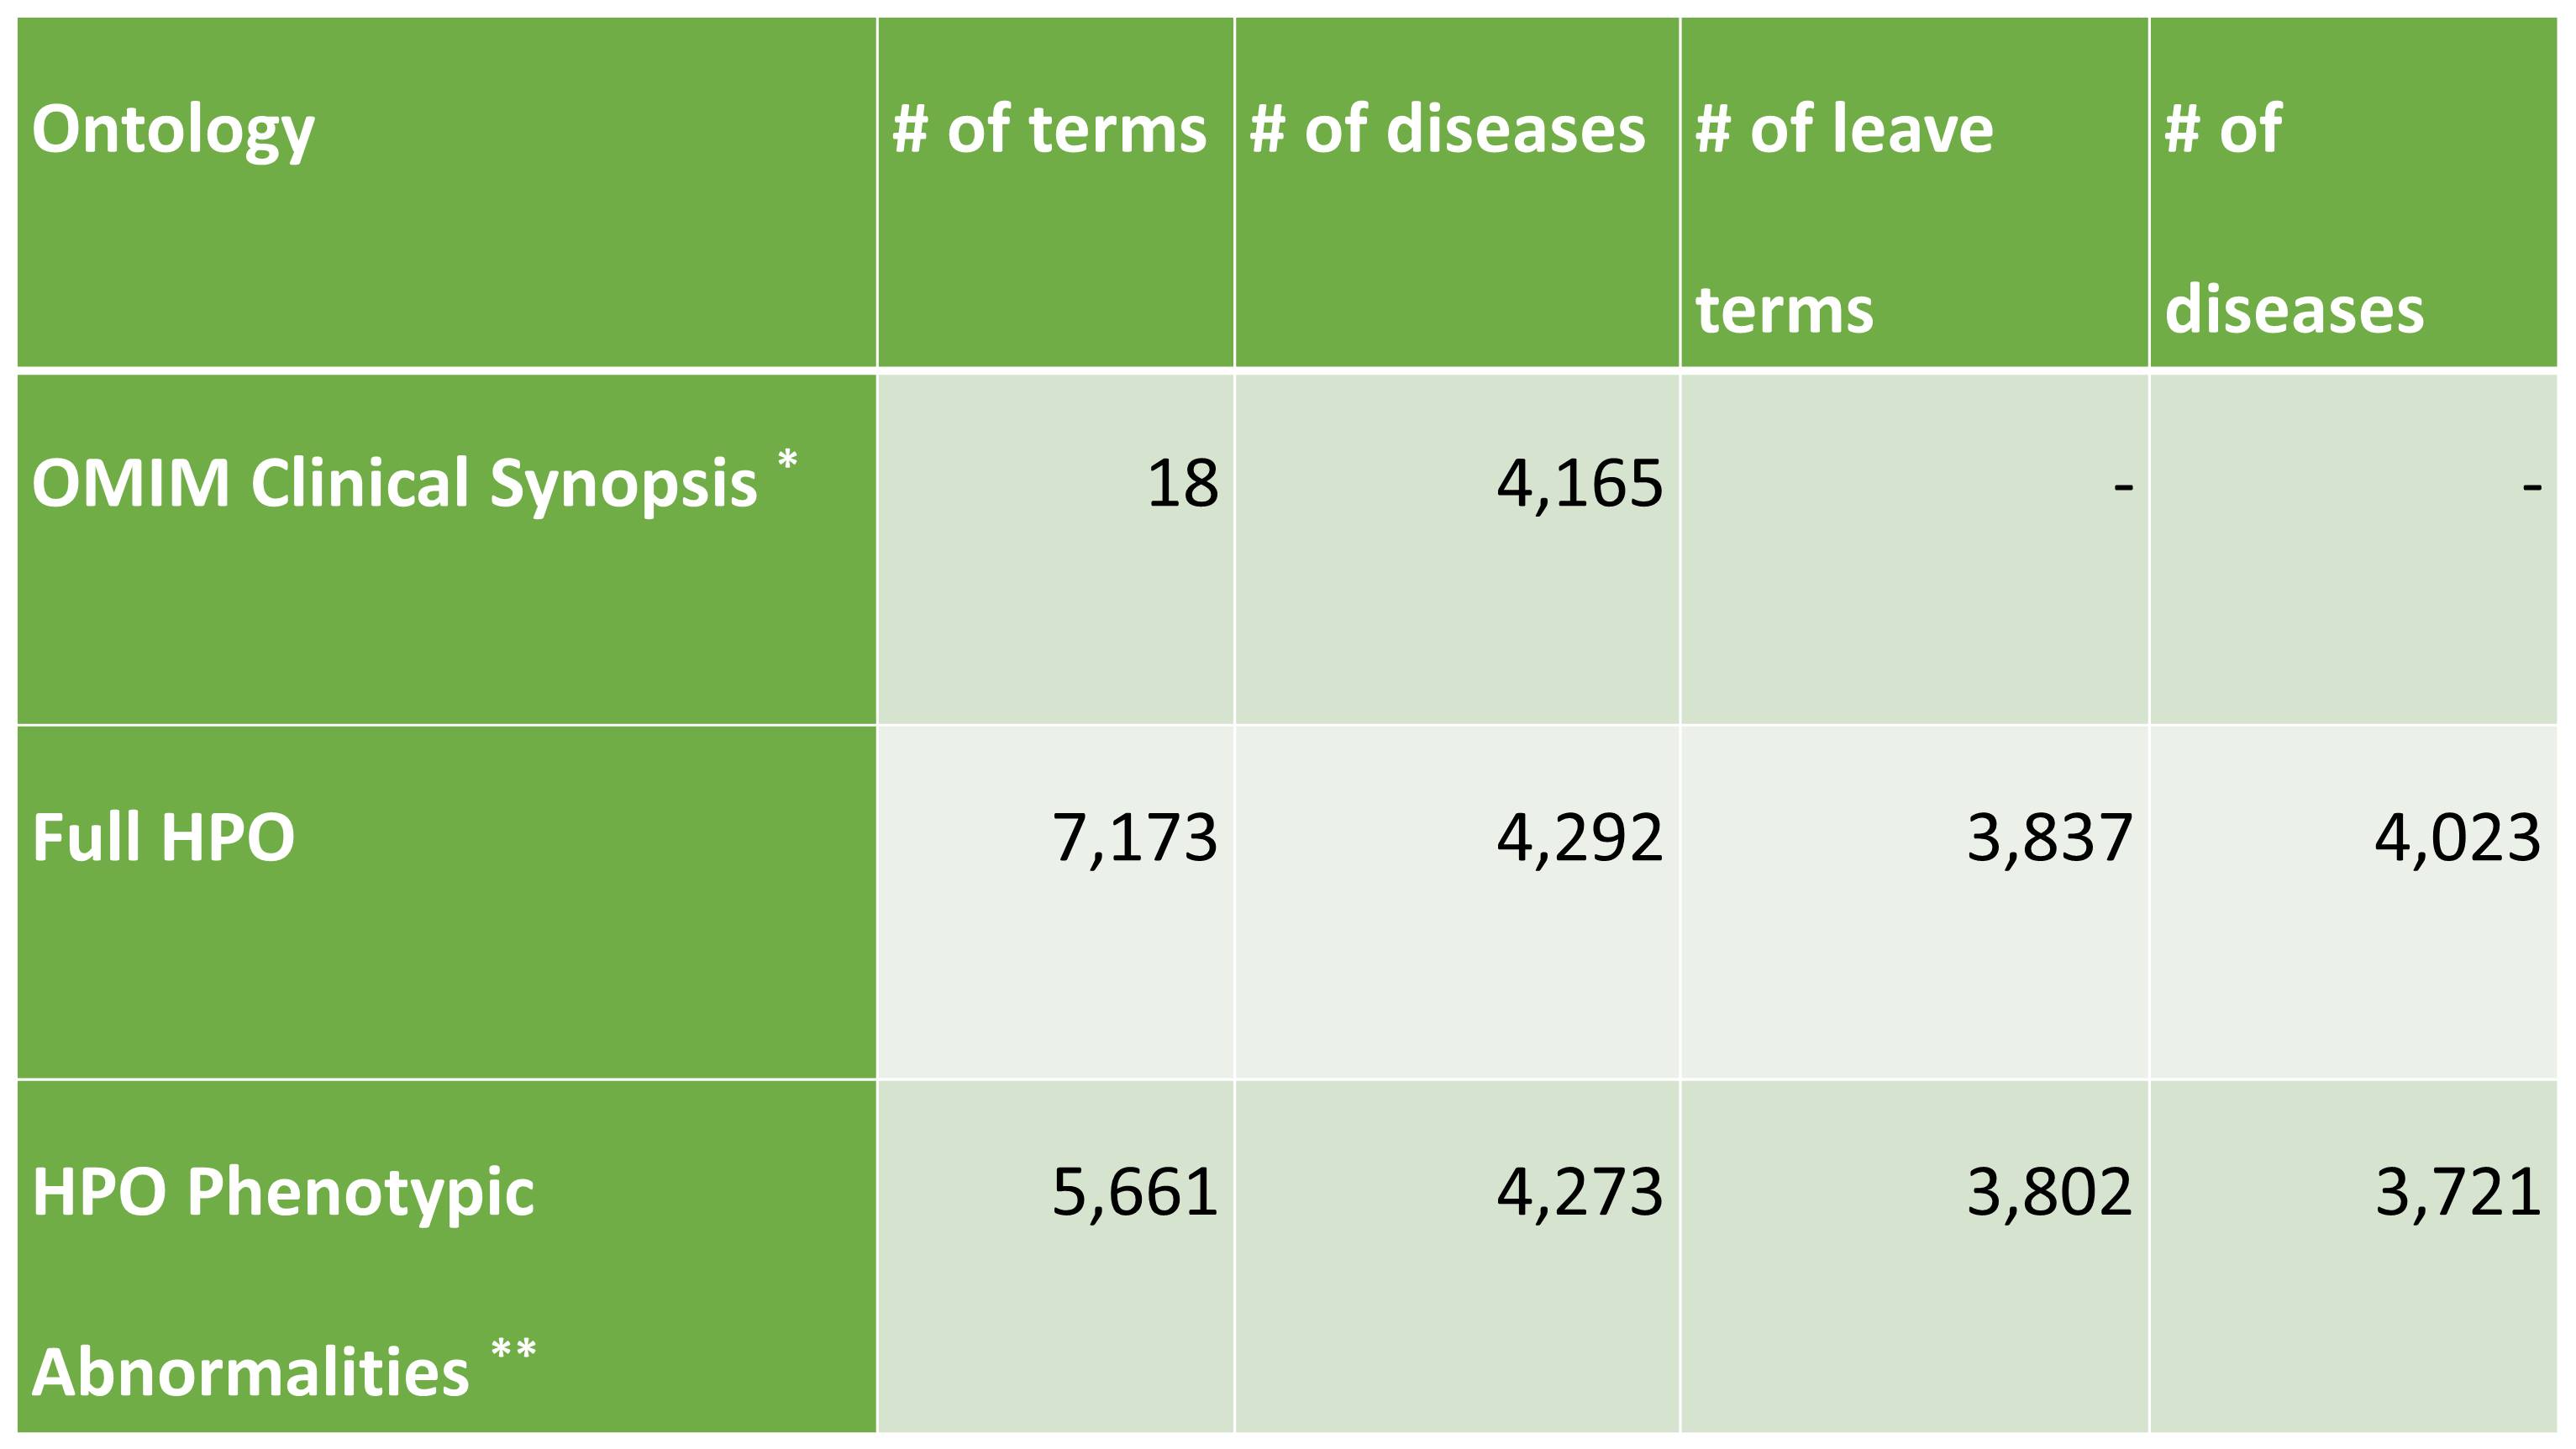
Table 1: PhenPathDB statistics.
Phenotypic terms included in PhenPathDB.
*OMIM Clinical Synopsis is not organized in a graph and there is not distinction among root, intermediate and leave terms.
**HPO Phenotypic Abnormalities are the subset of full HPO organized on the basis of body districts and physiological
functions in 24 different root terms.
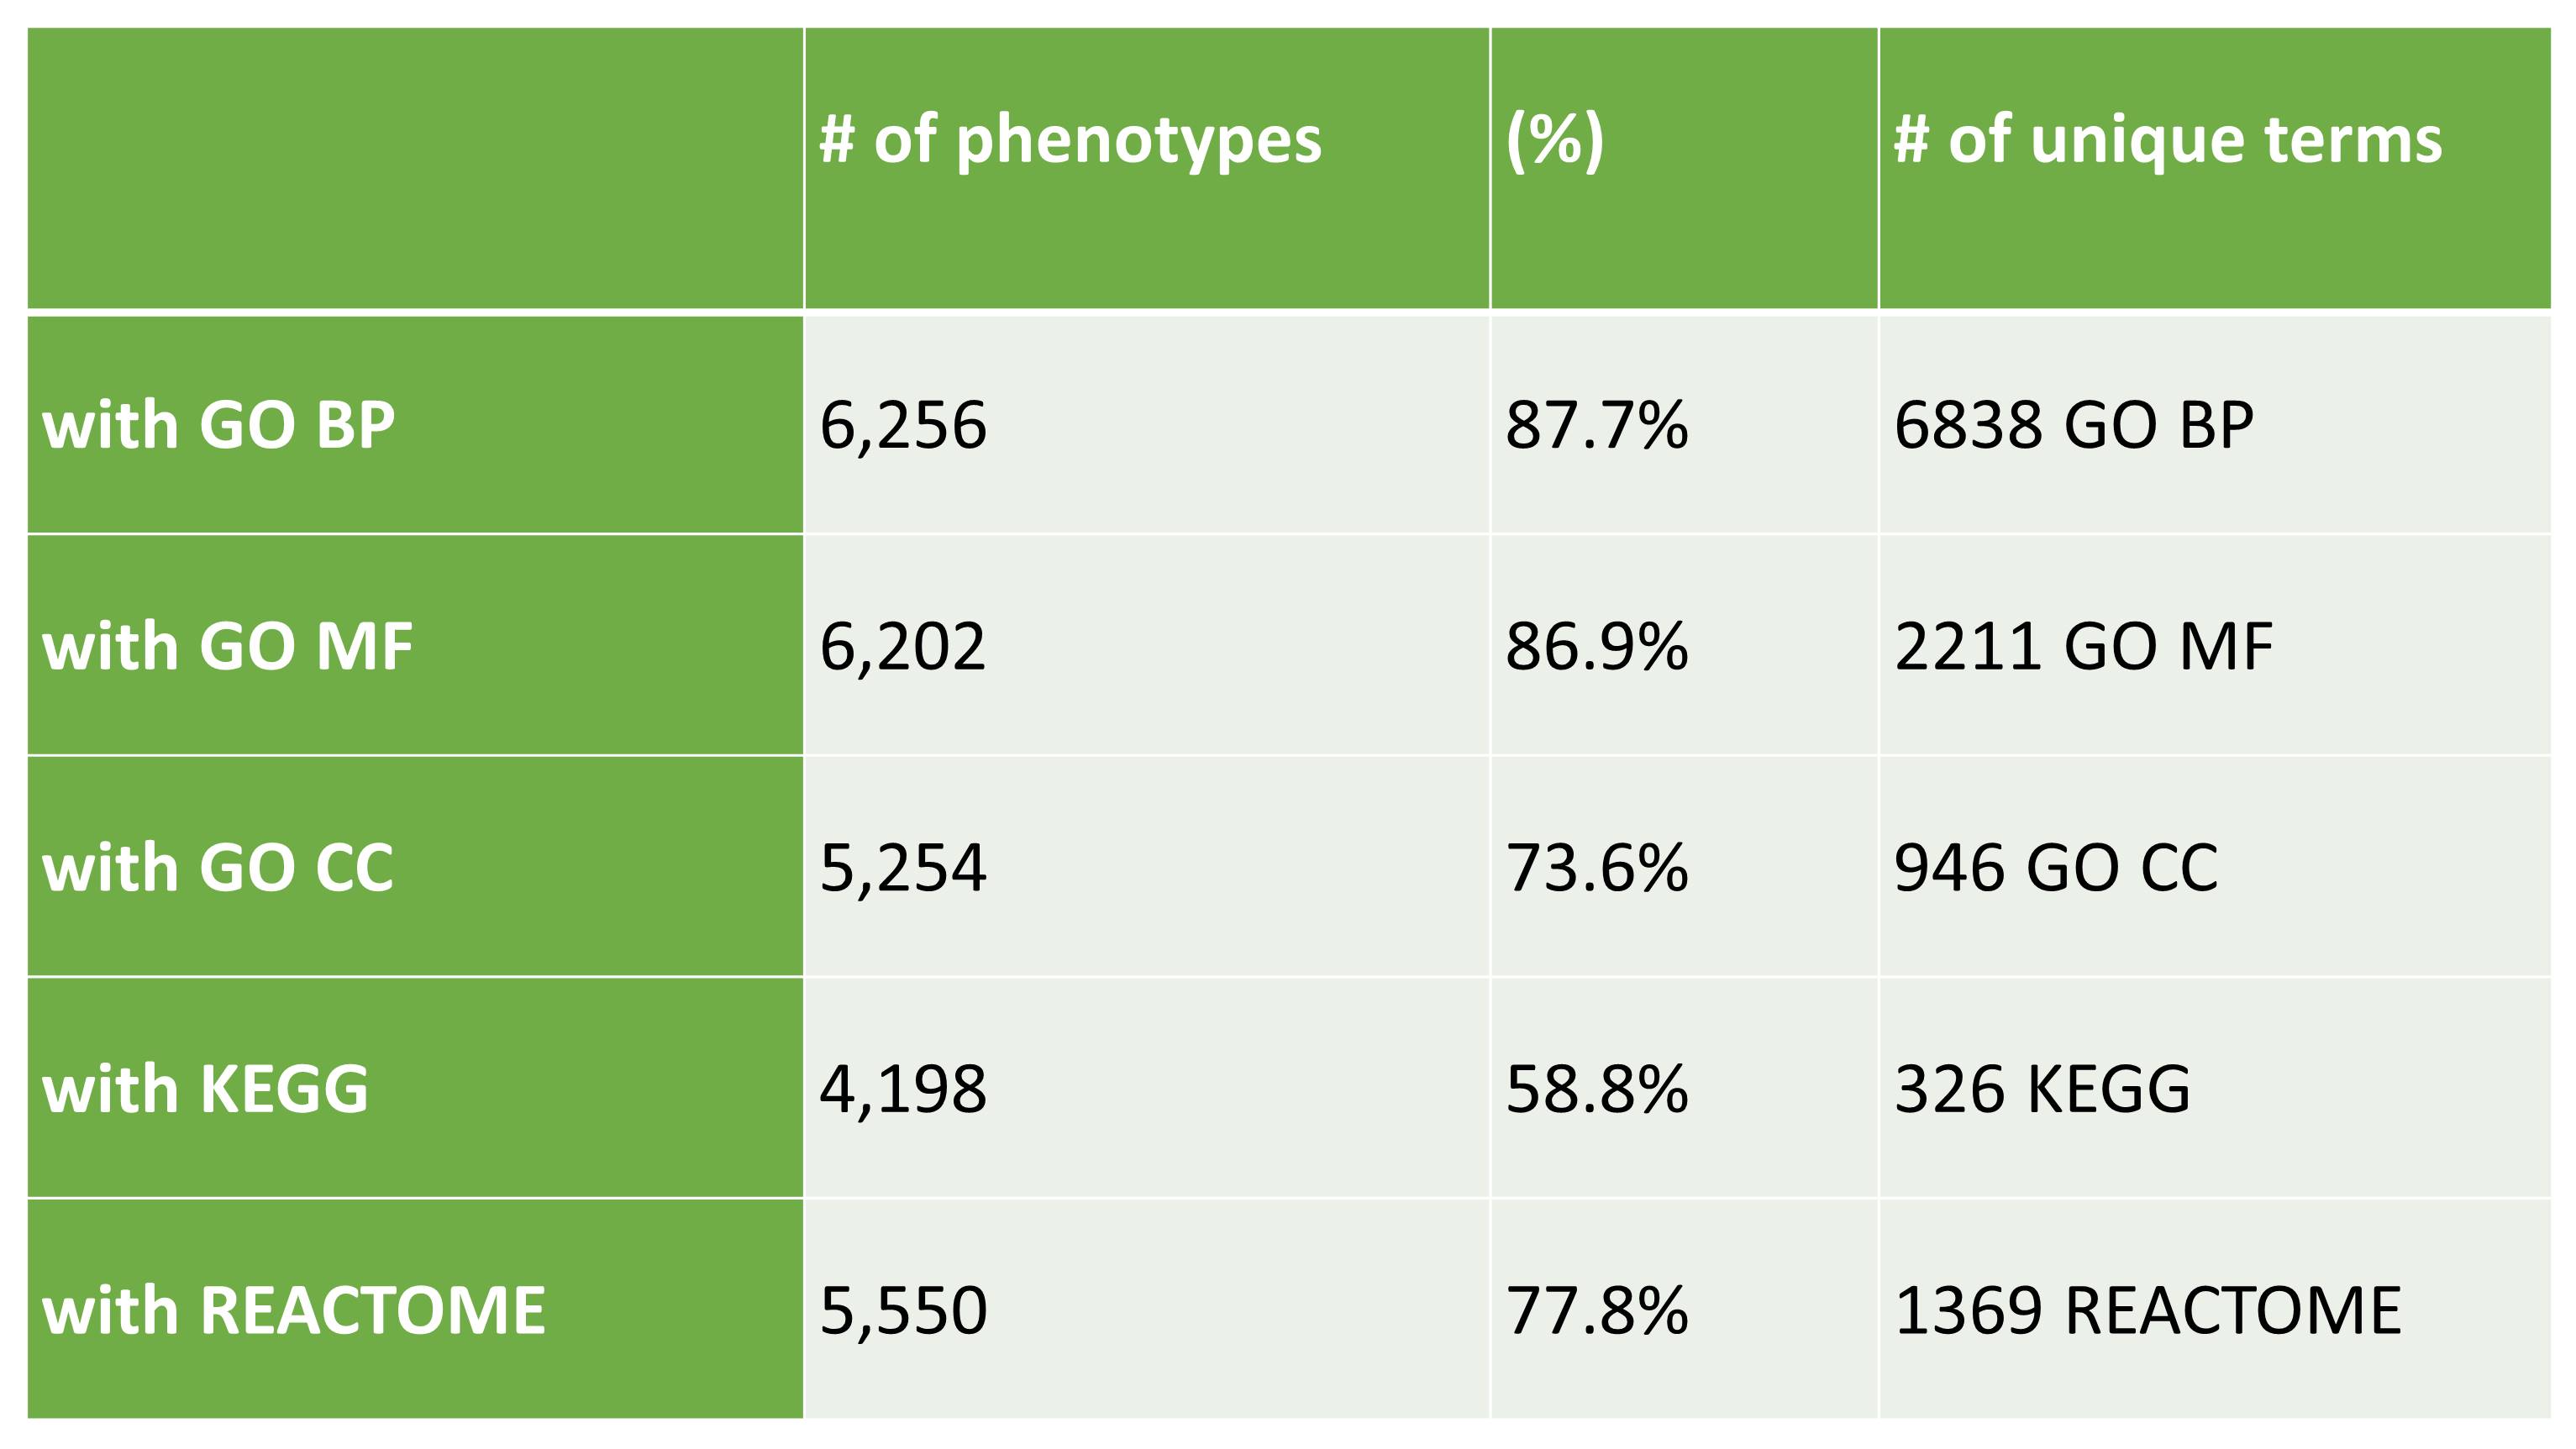
Table 2: PhenPathDB statistics.
Functional annotation of HPO terms.
Statistics refer to 7,137 HPO terms represented in PhenPath, associated with 4,292 diseases and 3,446 genes.
The terms presented in PhenPath comprise 59% of the 12,111 terms listed in HPO.
BP: Biological Process; MF: Molecular Function; CC: Cellular Component.
Considering only phenotypes that are leaves in the HPO graph, 3837 HPO phenotypes leaves are associated with 4023 OMIM diseases (Figure 1, below).
Among them, only 15% of the diseases is associated with one phenotype,
and about half of the diseases are associated with 5 or more phenotypes. Disease associated with multiple symptoms are often complex and rare disorders,
like the Rubinstein-Taybi syndrome that has the maximum number of associated HPO phenotypes (48, considering only leaves of the HPO graph).
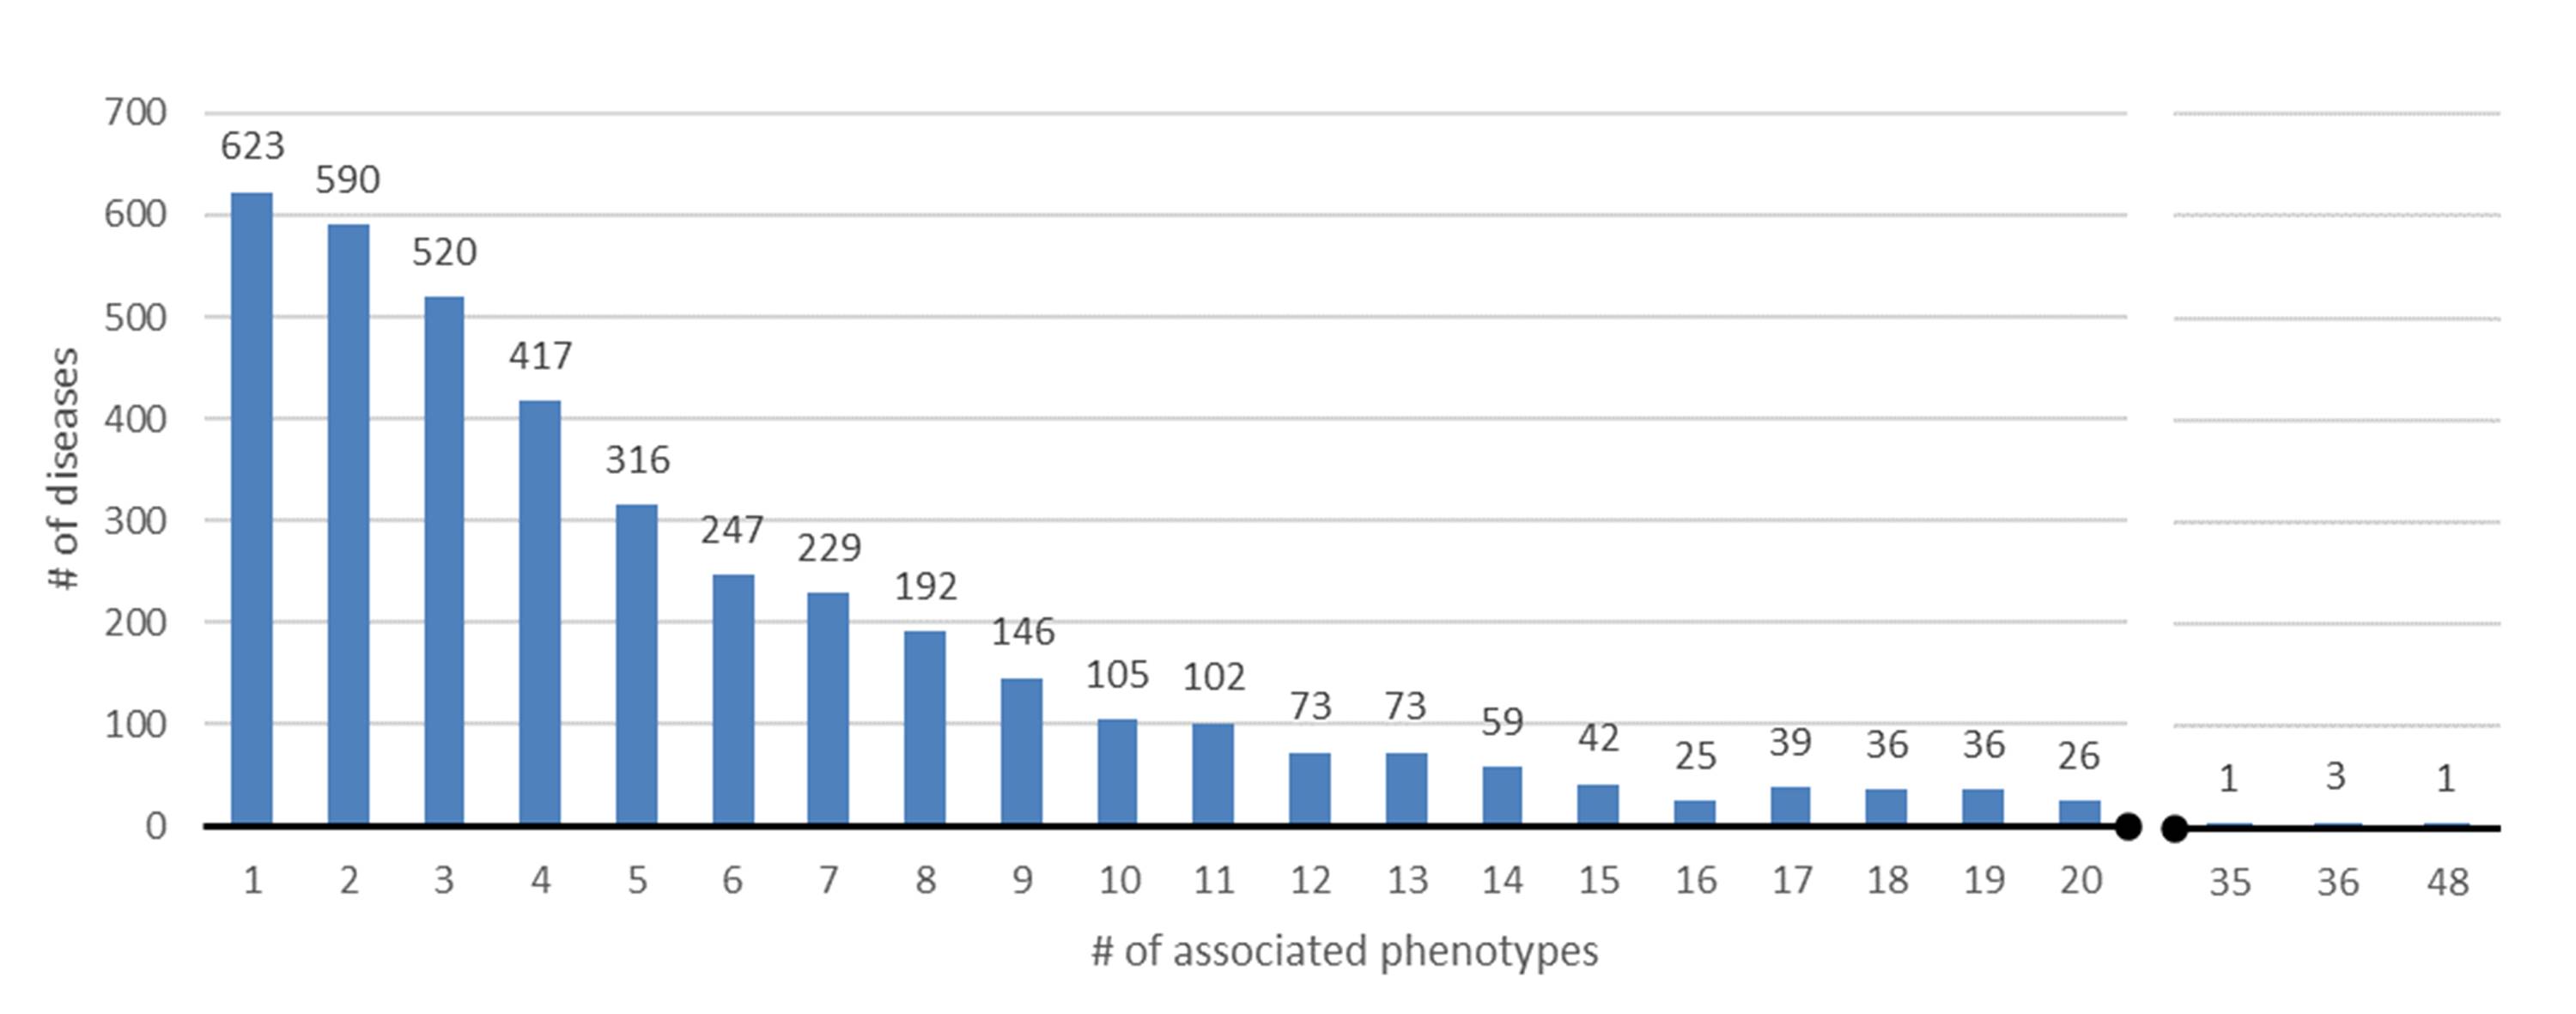
Figure 1: OMIM diseases as a function of associated HPO phenotypes.
We adopt the Clinical Synopsys classification from OMIM and the Phenotypic Abnormalities categories from HPO.
The OMIM Clinical Synopsys includes 22 clusters collecting 3303 diseases.
We use the curated database eDGAR to establish the gene-disease associations.
The final distribution of the number of diseases and genes for each cluster is shown in Figure 2.
Gene-disease associations has been performed considering HPO classes (24 clusters) and the resulting distribution is reported in Figure 3.
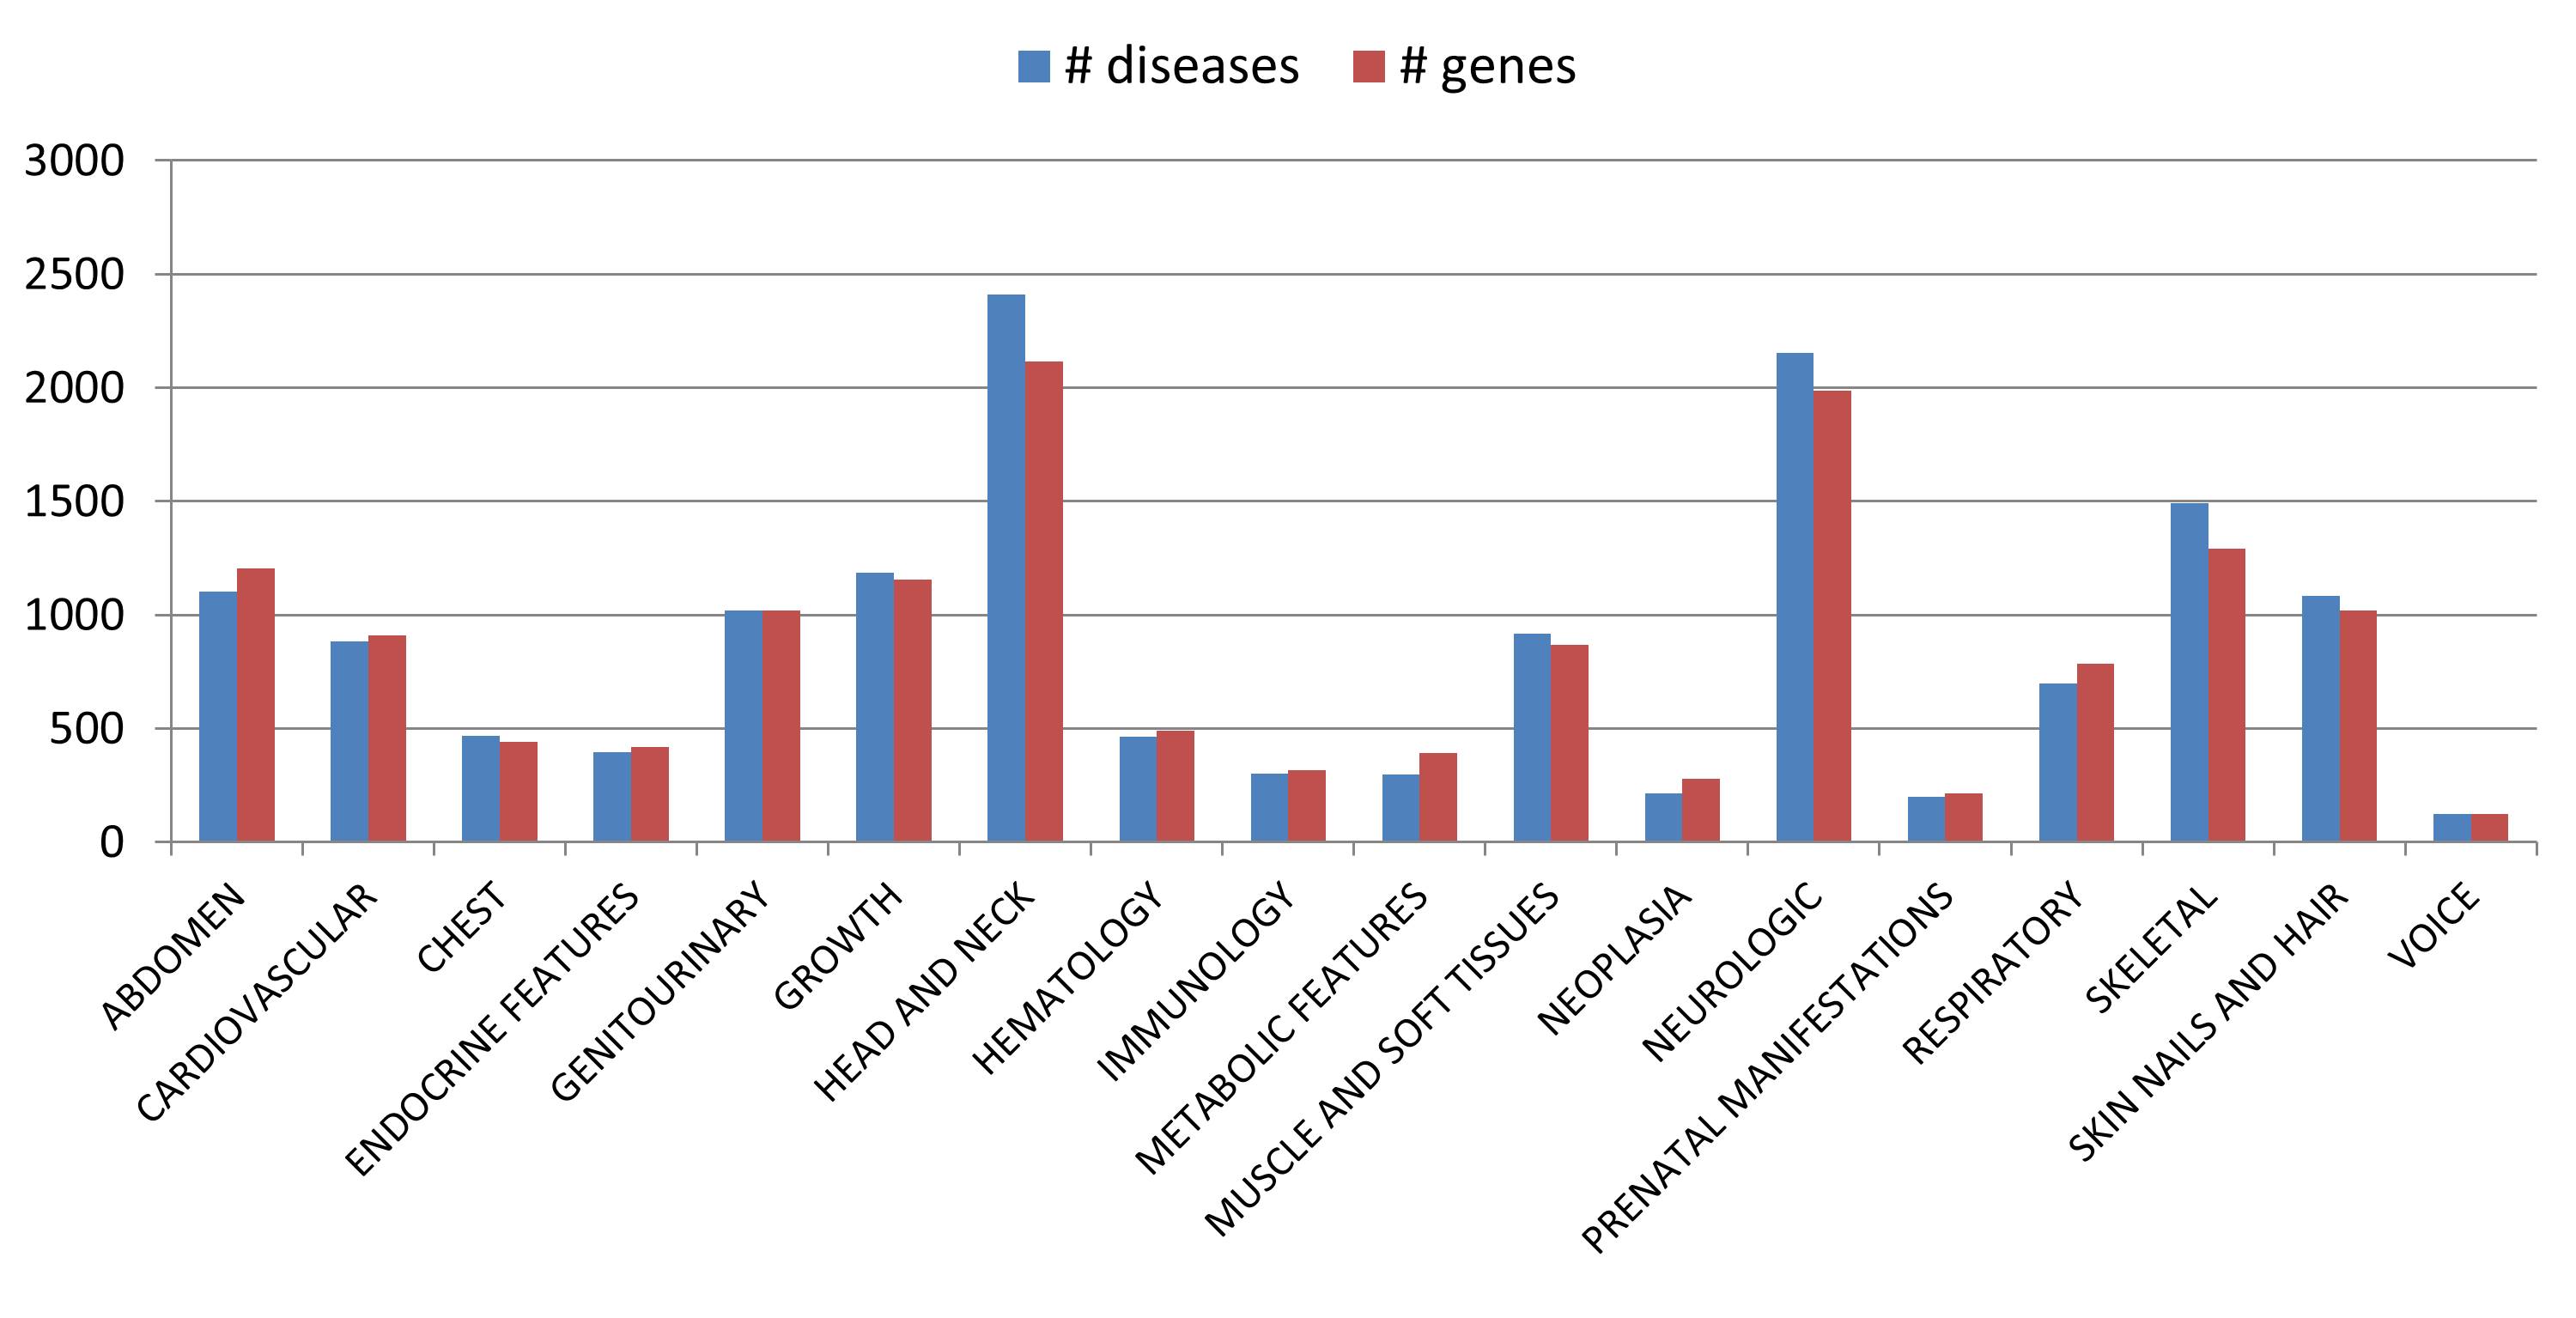
Figure 2: Clusters of diseases and associated genes according to the OMIM Clinical Synopsys.
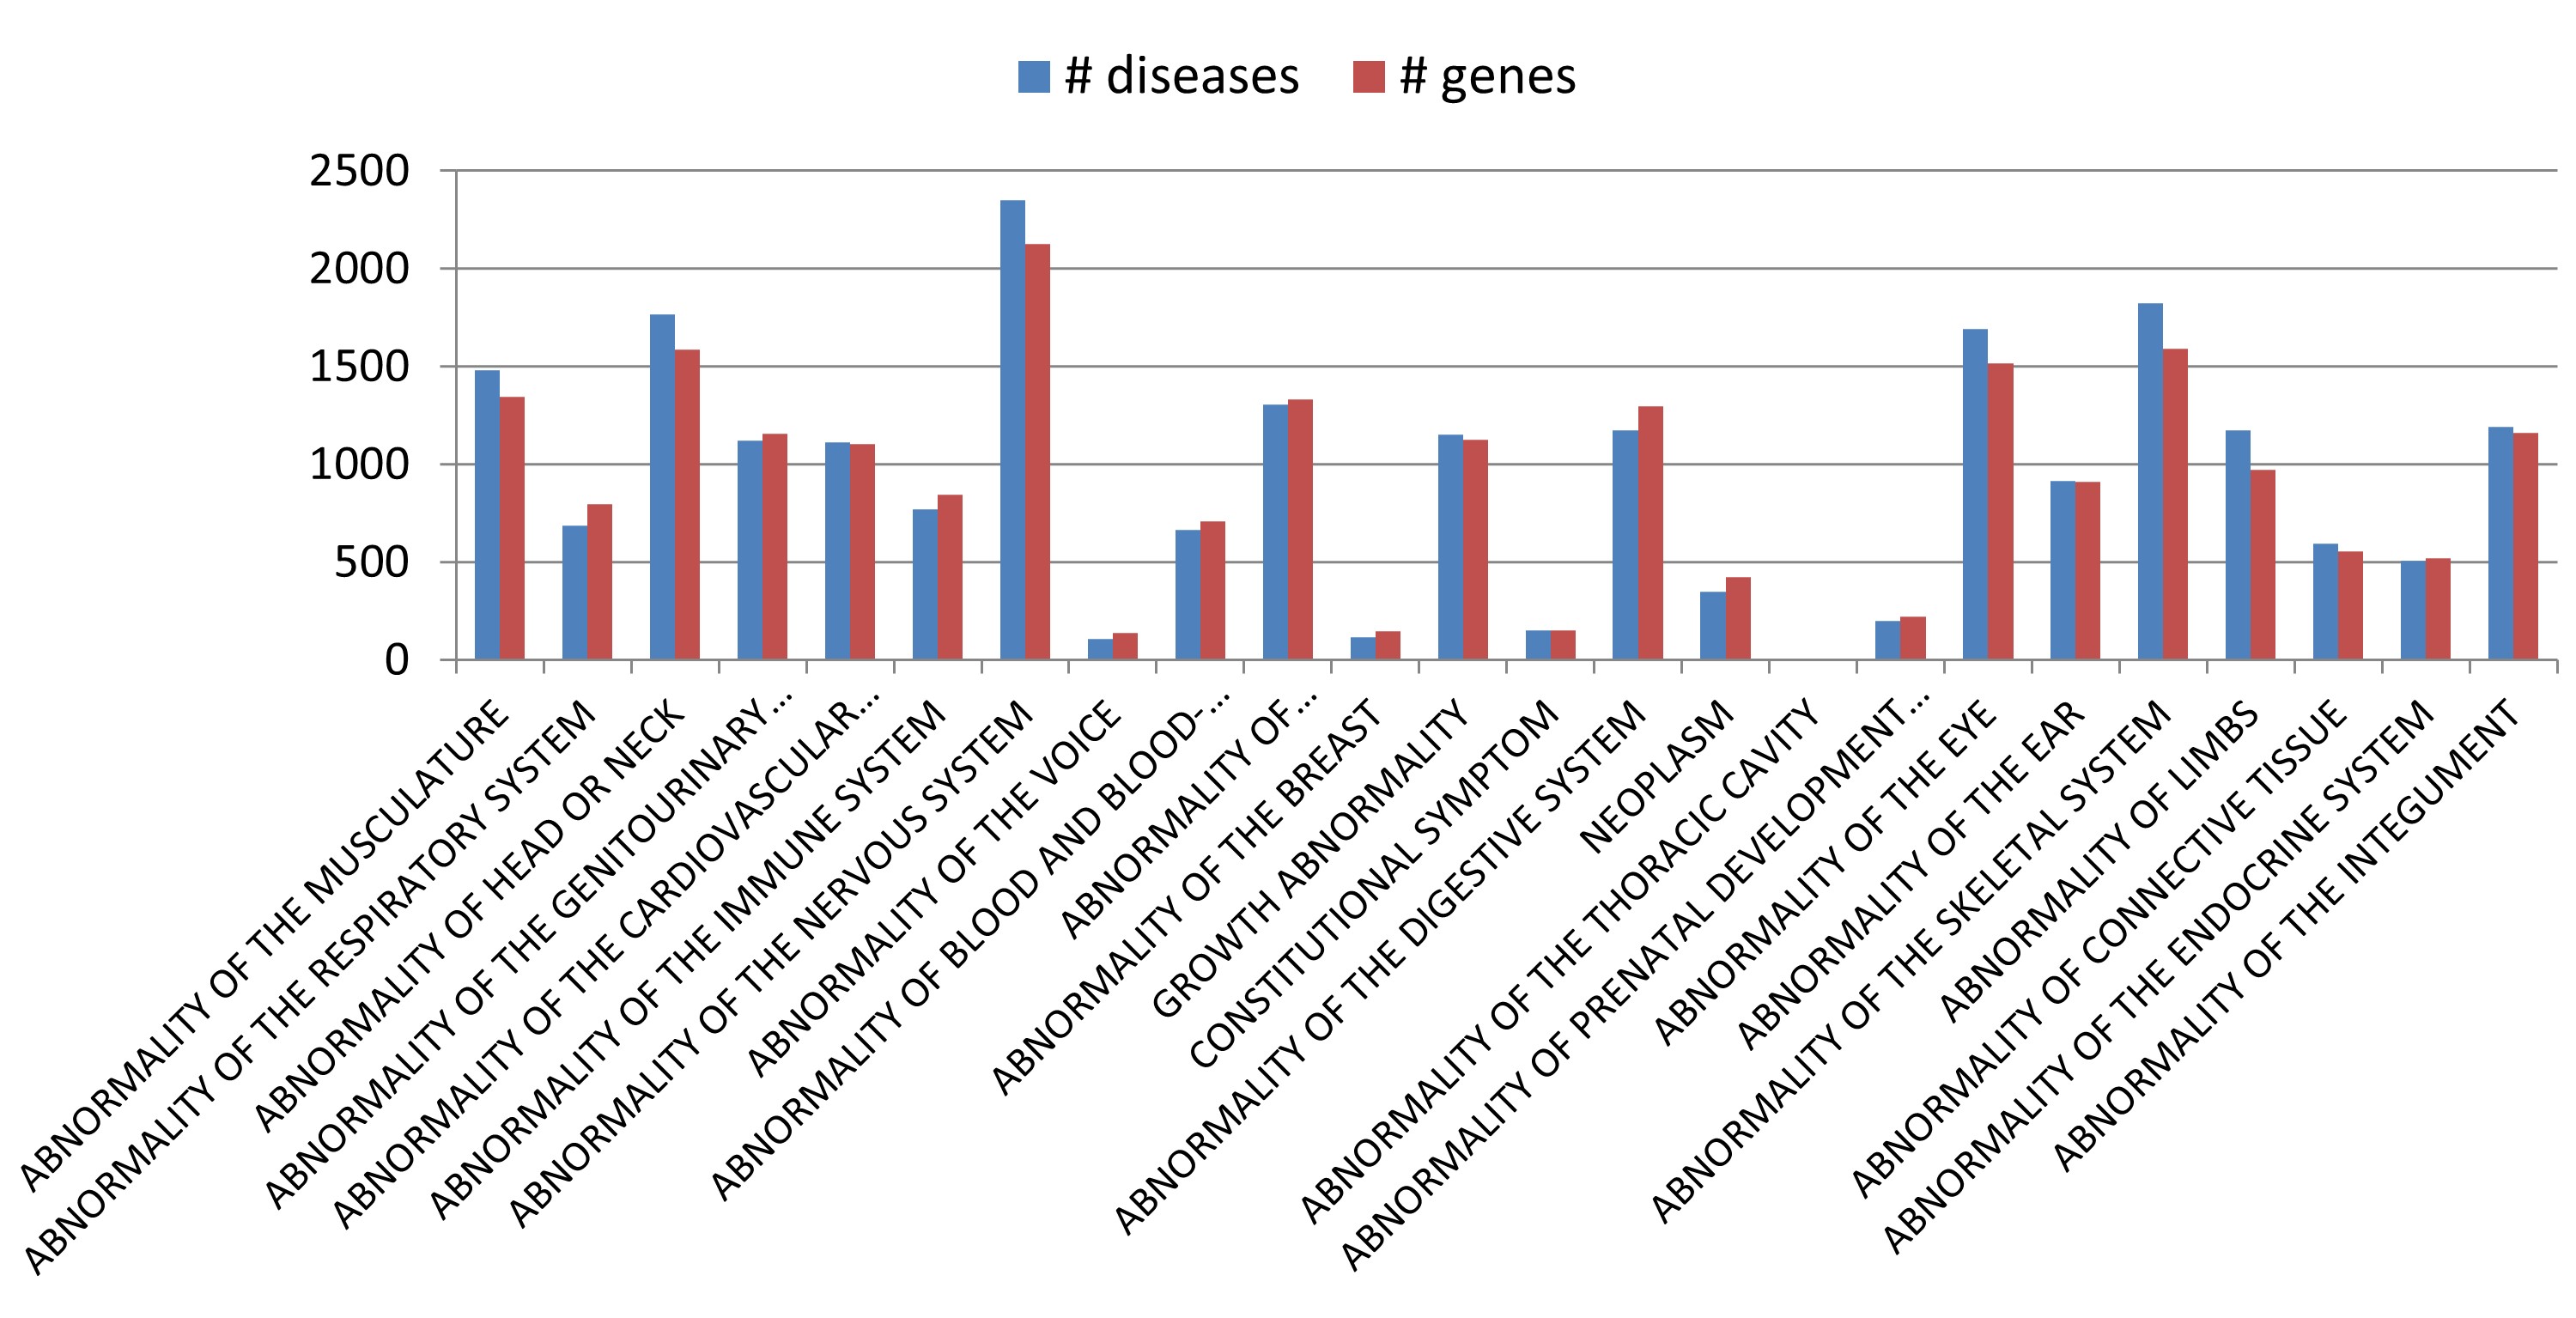
Figure 3: Clusters of diseases and associated genes according to HPO classification.